Cisco UCS, multi-queue NICs, and RSS
The other day one of my colleagues at Redpill Linpro asked me to help him figure out why a web cache server started responding slowly during a traffic peak. My colleague was scratching his head over the problem, because although the traffic level was unusually high for the server in question, it was nowhere close to saturating the server’s 10 Gb/s of available network bandwidth:

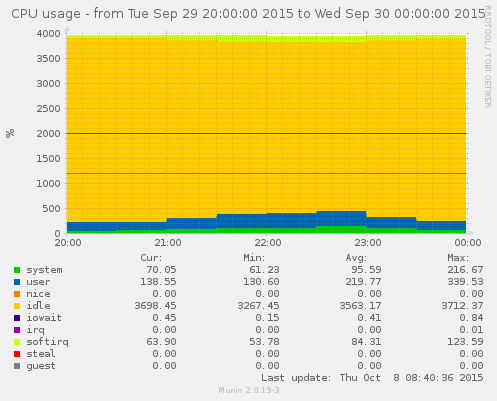
The server was running the Varnish Cache, a truly excellent piece of software which, when running on modern hardware, will easily serve 10 Gb/s of web traffic without breaking a sweat. The CPU graph confirmed that lack of processing capacity had not been an issue; the server in question, a Cisco UCS B200 M3, had been mostly idling during the problematic period:
In spite of the above, another graph gave a significant clue as to what was going on - the network interface had been dropping quite a few inbound packets:

That certainly explained the slowness - dropped packets lead to TCP timeouts and subsequent retransmissions, which will be rather damaging to interactive and latency-sensitive application protocols such as HTTP. My colleague had correctly identifed what had happened - the remaining question was why?
Diagnosing the root cause of the dropped packets
Checking the output from the diagnostic commands ip -s -s link show dev eth5
and ethtool -S eth5 on the server in question revealed that every single one
of the dropped packets were missed due to rx_no_bufs. In other
words, inbound packets had been arriving faster than the server had been able
to process them.
Taking a closer look at the CPU graph revealed a subtle hint: the softirq
field had exceeded 100%. While it is not possible to tell with certainty from
the aggregated graph, this could mean that a single one of the server’s 40
CPU cores had been completely busy processing software interrupts - which
happens to be the where incoming network packets are processed. (If you’re
interested in learning more about Linux’ software interrupt mechanism, take a
look at this LWN article.)
I then checked how many interrupts the network adapter had:
tore@ucstest:~$ awk '/eth5/ {print $NF}' /proc/interrupts
eth5-rx-0
eth5-tx-0
eth5-err
eth5-notify
Only a single receive queue! In other words, the server’s network adapter did not appear to be multi-queue NIC. This in turn meant that every incoming packet during the problematic period would have been processed by single CPU core. This CPU core would in all likelihood have been completely overloaded, while all the other 39 CPU cores were just sitting there with almost nothing to do.
Enabling multiple queues and Receive-side Scaling
It fortunately turned out that the network adapter in question, a Cisco UCS VIC 1240, is a multi-queue NIC - but this functionality is for some unfathomable reason disabled by the default ethernet adapter policy:
ucs1-osl3-B# scope org
ucs1-osl3-B /org # enter eth-policy default
ucs1-osl3-B /org/eth-policy # show expand

Eth Adapter Policy:
    Name: default

    ARFS:
        Accelarated Receive Flow Steering: Disabled

    Ethernet Completion Queue:
        Count: 2

    Ethernet Failback:
        Timeout (sec): 5

    Ethernet Interrupt:
        Coalescing Time (us): 125
        Coalescing Type: Min
        Count: 4
        Driver Interrupt Mode: MSI-X

    NVGRE:
        NVGRE: Disabled

    Ethernet Offload:
        Large Receive: Enabled
        TCP Segment: Enabled
        TCP Rx Checksum: Enabled
        TCP Tx Checksum: Enabled

    Ethernet Receive Queue:
        Count: 1   <------ only 1 receive queue configured!
        Ring Size: 512

    VXLAN:
        VXLAN: Disabled

    Ethernet Transmit Queue:
        Count: 1   <------ only 1 transmit queue configured!
        Ring Size: 256

    RSS:
        Receive Side Scaling: Disabled
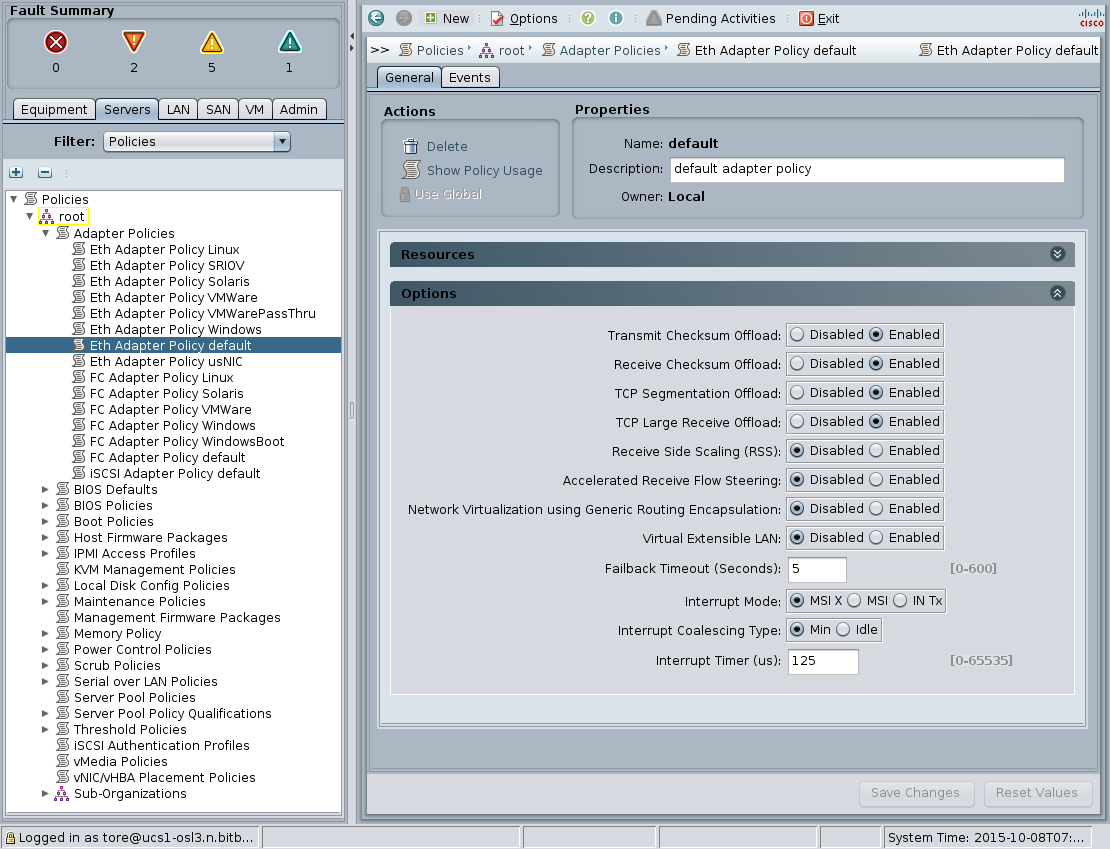
These settings can also be seen (and changed) in the UCS Manager GUI, under Servers -> Policies -> Adapter Policies:
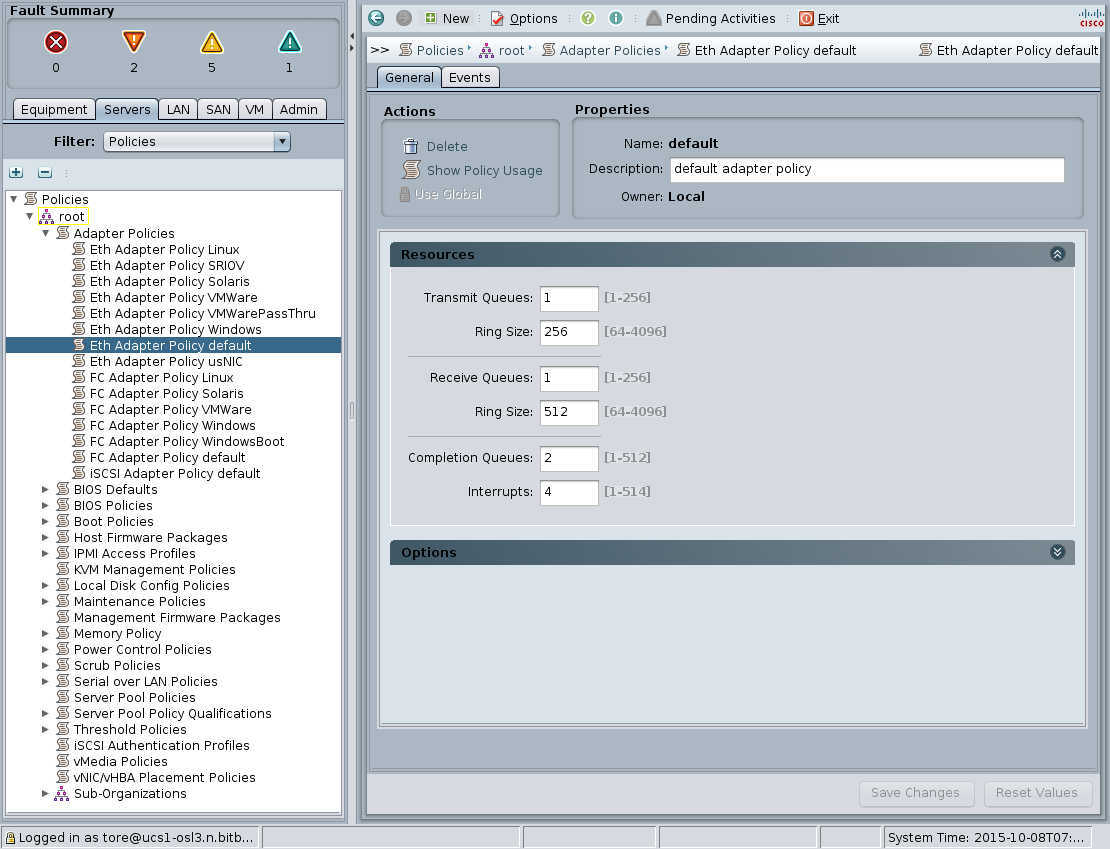
Fortunately, it was possible to improve matters by simply changing the ethernet adapter policy. Hardware in a Cisco UCS environment can take on different personalities based on software configuration, and the number of queues in a network adapter is no exception. The below commands shows how you can increase both the number of receive and transmit queues:
ucs1-osl3-B# scope org
ucs1-osl3-B /org # enter eth-policy default
ucs1-osl3-B /org/eth-policy # set recv-queue count 8
ucs1-osl3-B /org/eth-policy* # set trans-queue count 8
However, in order to actually make use of the multiple receive queues, it is also necessary to enable Receive-side scaling (RSS). RSS is what ensures that the network adapter will uniformly distribute incoming packets across its multiple receive queues, which in turn are routed to separate CPU cores. In addition, it is necessary to configure the number of completion queues to the sum of configured receive and transmit queues, and the number of interrupts to the number of completion queues plus 2:
ucs1-osl3-B /org/eth-policy* # set rss receivesidescaling enabled
ucs1-osl3-B /org/eth-policy* # set comp-queue count 16
ucs1-osl3-B /org/eth-policy* # set interrupt count 18
One might stop at this point to wonder why one has to explicitly enable RSS
when recv-queue count is configured to more than 1, and similarly why the
values for comp-queue count and interrupt count must be explicitly set
intead of being automatically calculated. I have no idea. It is what it is.
Finally, I also noticed that Accelerated Receive Flow Steering (ARFS) is supported, but not enabled by default. Reading about it (and RFS in general), it seems to me that ARFS is also something that you really want by default if you care about performance. Thus:
ucs1-osl3-B /org/eth-policy # set arfs accelaratedrfs enabled
(Yes, accelaratedrfs is the spelling expected by the UCS CLI.)
Activating the changes at this point is only a matter of issuing the standard
commit-buffer command. That said, do be aware that a reboot will be required
to activate these changes, which in turn means that any service profile that’s
using this ethernet adapter policy and has a maintenance
policy
set to immediate will instantly reboot.
After the reboot, we can see that the ethernet adapter now has the requested number of queues and interrupts available:
tore@ucstest:~$ awk '/eth5/ {print $NF}' /proc/interrupts
eth5-rx-0
eth5-rx-1
eth5-rx-2
eth5-rx-3
eth5-rx-4
eth5-rx-5
eth5-rx-6
eth5-rx-7
eth5-tx-0
eth5-tx-1
eth5-tx-2
eth5-tx-3
eth5-tx-4
eth5-tx-5
eth5-tx-6
eth5-tx-7
eth5-err
eth5-notify
Problem solved! The server is now much better prepared to deal with the next traffic peak, as inbound traffic will now be distributed across eight CPU cores intead of just one. I expect that the server’s 10 Gb/s of available network bandwidth will be saturated with outbound traffic long before the rate of incoming packets would become a bottleneck.
Note that it’s also important to ensure that the
irqbalance daemon is running.
Without it, all eight eth5-rx-* interrupts could potentially end up being
routed to the same CPU core anyway, which would mean we’ve gained absolutely
nothing. Fortunately, irqbalance is enabled by default on most Linux
distributions.
Regarding hardware limitations
You might wonder why I enabled only eight queues for each direction, given that
the blade in question has 40 CPU cores. Well, I did try to enable more, and
while it is indeed possible to configure up to a maximum of 256 transmit and
receive queues in a UCS ethernet adapter policy, checking /proc/interrupts
after rebooting will reveal that only 8+8 were created anyway. I assume that
this is a hardware limitation. I also tested this with an older B200
M2
blade with an
M81KR
network adapter, and the limitation was exactly the same - only eight queues
per direction were created.
I have to say that a maximum of eight receive queues is far from impressive, as other common 10 Gb network adapters support many more. The Intel 82599 supports 128 receive/transmit queues, for example. That said, having eight receive queues can make a world of difference compared to having just the default single one.
I also found out that it is not safe to configure the maximum possible 256
transmit and receive queues in the ethernet adapter policy. One might assume
that doing so would cause the system to simply adjust the effective number down
to the maximum supported by hardware. However, that approach works only for
service profiles with a single vNIC; the service profile fails to associate if
it contains two or more vNICs with such a policy. Looking at the FSM status
while attempting this, the B200 M2 with the M81KR adapter gets stuck with an
error message of Out of CQ resources, while the B200 M3 with the VIC 1240
would get Adapter configDataNicCb(): vnicEthCreate failed. Attempting to
reboot them in this state didn’t work either, they just got stuck - the M2
blade entered the EFI shell, while the M3 entered the BIOS Setup utility.
Thus my conclusion is that the optimal number of receive and transmit queues to configure in the default ethernet adapter policy is 8+8 for any server containing the M81KR or VIC 1240 adapter. For other adapter models, attempting a boot with 256+256 queues and a single vNIC is probably a good way to determine the actual hardware limitations (and, by extension, the optimal default values for that particular adapter model).
In any case, discovering the default UCS behaviour was kind of like coming home after having bought a new sports car with a V8 engine, only to discover that the manufacturer had only bothered to install a spark plug in one out its of eight cylinders. It is truly a terrible default! If someone at Cisco ever reads this, I’d strongly suggest that the default behaviour would be simply to enable the maximum number of queues supported by the hardware in question. That’s the only way to unleash the full performance of the hardware, and it is certainly a prerequisite in order for a web server workload to come anywhere near fully utilising the 10 Gb/s of available network bandwidth.